


Scientific Injection Molding Process Ensures Repeatable Part Function
How to create consistency in injection molding part production through detailed, scientific processes
Scientific, decoupled, and intelligent molding are commonly used terms within the plastics industry to describe an injection molding methodology that allows for consistent, repeatable parts to be efficiently produced in a system with many sources of variation. This guide covers the basic steps in setting up this process in order to create the most accurate, repeatable molded parts for you.

Determining Optimum Fill Speed: In-mold Rheology Curve
An important first step is to determine a robust fill-speed setting that allows for inherent variations, which are seen both within polymers and injection molding press performance, all while reducing the variation imposed on the polymer melt that fills the mold cavity. This will help ensure repeatable part and/or product performance related to the polymer’s bulk properties.
First, a little background and theory on polymers is needed. Polymers are made up of long chain molecules. These molecular chains are entangled with one another, and can form crystalline regions in semi-crystalline materials. When a polymer is heated beyond its melting temperature, the crystalline regions break down in semi-crystalline resins. For both semi-crystalline and amorphous resins, the free volume between molecular chains is increased to a point that the molecular chains are allowed to move freely past each other.
As the material is being driven to flow, shear stress is imparted on the molecular chains. The shear stress begins to align the molecular chains in the direction of flow, thus allowing the chains to slip more easily past one another. As a result, as shear rate is increased, the easier the material will flow (viscosity drops).
This is a behavior seen with Non-Newtonian fluids. The viscosity will continue to drop as shear rate is increased until the molecular chains have reached full alignment. At the point of full alignment, the viscosity will remain constant with further increasing shear rate. This is known as the Upper Newtonian Plateau, as the material will now exhibit a more Newtonian fluid type of behavior [see Viscosity Change vs. Shear Rate chart above].
Let’s move from background to application. The fill-speed determination process attempts to capture this shear-thinning behavior of the material as it flows through the mold. The in-mold rheology curve plots apparent viscosity vs. shear rate using readouts from the press—actual injection pressure and actual fill time [see Rheology Curve chart below].

As seen in the Rheology Curve chart, as the shear rate is increased, the viscosity is reduced. At higher shear rates, the viscosity begins to level off. Choosing a fill speed that results in a shear rate in this plateaued region allows for material differences from lot to lot. Additionally at this fill speed, inconsistencies in the machine stroke speed/response will have a negligible effect on the viscosity of the material that is flowing into the mold cavity. This results in manufactured parts having more uniform molecular/filler orientation, heat history, and pressurization from shot to shot.
Looking at the process for determining a robust fill-speed setting also allows for the molding process to use the shear-thinning behavior of polymers to fill out smaller features, more accurately replicate mold geometry, improve weld line strength, and minimize potential for flow front hesitation. Be cautious, though: Don’t choose a fill speed that is too fast, resulting in very high shear rates. Shear rates that are too high can begin to degrade the polymer. The molecular chains can begin to break down, resulting in lower molecular weight. Lower molecular weight chains result in mechanical properties of the material being altered. This can lead to premature part failure. High shear rates are especially damaging to filled materials. Glass-fiber is a very common reinforcement for plastic materials, and often times has a shear rate limit well below that of the carrier material. When shear rates are too high, reinforcing fibers can be broken down, thus reducing their effectiveness.
Determining Optimum Hold Pressure
Next up is establishing a hold pressure setting that will pack out a part sufficiently, while reducing the potential for overpacking. A well-packed part will exhibit minimal volumetric shrinkage that would otherwise lead to sinks, voids, warpage, and so on while not being overly stressed to a point that could lead to premature failures such as cracking, or cause issues in the molding process such as flash or trouble ejecting from the mold.
When plastic melt enters the mold cavity, it is at a lower density than when the polymer is solidified. As the plastic cools, the free volume between the molecular chains reduces. The illustration on page 5. highlights the state changes that occur with amorphous, semi-crystalline, and liquid-crystal polymers.
If the material is a semi-crystalline, portions of the chains can form highly ordered regions known as lamellae. These lamellae make up the crystalline regions known as spherulites. These regions exhibit relatively high local densities. The reduction of free volume, and the possible formation of crystalline regions, results in shrinkage of the overall melt volume.
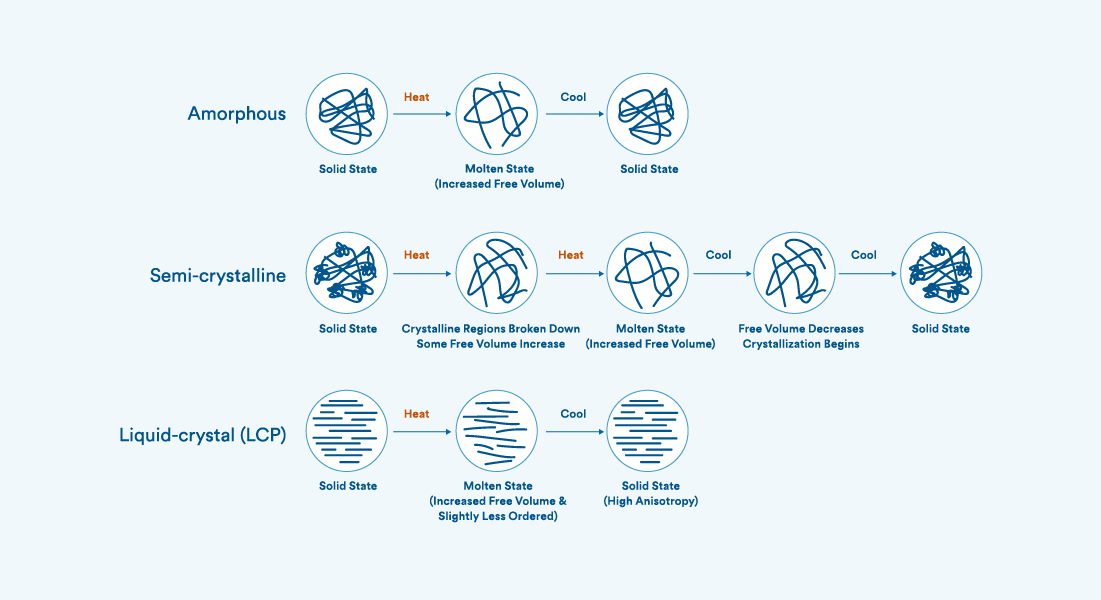
This illustration highlights the changes that occur with amorphous, semi-crystalline, and liquid-crystal polymers.

In order to counteract this shrinkage as the plastic cools and solidifies, pressure must be applied to compensate.
Hold pressure is used to force more plastic material into the mold cavity to increase the density of the molded part. This helps prevent volumetric shrinkage-driven issues such as sinks and voids.
The application of hold pressure also helps to keep the material at the outer surface of the molded part in intimate contact with the mold wall, thereby improving conductive heat transfer, facilitating cooling. Once the material has solidified, it can no longer effectively transmit pressure. This is why it is important to maintain uniform wall thicknesses in plastic part design, as well as use a thick-to-thin gating scheme.
Determining optimum hold pressure involves identifying the lowest amount of packing pressure to adequately fill the remainder of the mold cavity that was intentionally left short during the filling phase, and reduce any shrinkage related issues to an acceptable level.
Then, the highest acceptable packing pressure is also identified by finding the pressure in which the mold begins to flash, or other issues arise with the part, such as the part sticking upon ejection. These points—the lowest and highest—establish the acceptable packing pressure window for a specific melt temperature.

Selecting a point two thirds of the way between these points provides for a setting that will effectively pack the part, while minimizing overpacking issues [see illustrations].
Determining Optimum Hold time (Gate Freeze)
Next up is determining a hold time setting that will allow for pressure to be transferred from the machine nozzle to the cavity for as long as the gate remains open.
Applying positive pressure to the cavity for as long as the gate remains open yields the most packed part at a given hold pressure. Applying pressure until gate freeze also prevents backflow of material from the cavity into the feed system. The more packing, the lower the volumetric shrinkage of the molded component. Typically this results in an optimally packed part, although there are special cases where using a hold time shorter than gate freeze may be preferential. Minimizing the volumetric shrinkage of a molded component requires that the optimal packing pressure is applied for an effective amount of time.
As plastic cannot effectively transfer pressure once it is solidified, the amount of time for effective packing becomes geometry-dependent. As previously discussed, thin sections within the part can freeze off quicker than thick sections and isolate regions from packing pressure.

Following standard practices for injection molding part and mold design, it is common that gates will be placed in an area that allows for thick to thin packing, and the gates are typically sized as a percentage of the wall thickness being gated into.
Common gate sizes typically range from 60% to 80% of the wall thickness, but certain gate designs require more restrictive sizes to facilitate separation from the part wall.
Given that the gate is typically thinner than the part wall, the gate will solidify before the part geometry. Once the gate is solidified, pressurization of the part cavity from the feed system is complete.
There is no need to continue applying packing pressure once the gate is frozen, as this will only pack out the feed system.
Gate freeze determination involves tracking the weight of the part when different hold times are used. As long as the gate is open, and the cavities continue to be packed, the part weights will continue to increase.

Once part weights reach a stable level, it can be inferred that the gate has frozen, and the parts are no longer being packed. The hold time where the weights have leveled off can be considered the time for gate freeze.
Typically a buffer of one to two seconds is added to the hold time setting to ensure that the gate is frozen regardless of any inherent variation within the material or machine.
In the Gate Freeze chart, it can be seen that the part weight continued to increase as more hold time was used. As the gate began to solidify to a larger extent, the rate of weight gain begins to slow.
In this example, five seconds is the first point where the weight has stabilized. This indicates that the gate has frozen somewhere between four and five seconds, and a one-second buffer has been added to ensure process robustness.
If you want to find out more about how injection molding works, our applications engineers are available to talk to you about molding and your designs and products. Contact one of them at 877-479-3680 or at [email protected].